class: center, middle, inverse, title-slide # Method: Large-N Approach ## Public Policy Analysis: Perspectives and Methods (30700953) ### Yue HU --- ## Overview - What's large-N - Why large-N - How large-N .center[<img src="images/lar_econometrics.jpg" height = 300 />] --- class: inverse, bottom # What's Large-N --- ## Large-N: A Terminology In lieu of "quantitative"... ??? What's a 定量研究? Did you really 定量? -- N: Number of .red[observations]---not subjects, not trails Large: Well...... > We don't know...... > It depends...... > The larger, the better! -- .pull-right[ ⇓ 1. Why large-N? 1. How large is large? ] --- class: inverse, bottom # Why Large-N --- ## When Large-N? Experiment is not an option! - Practical reasons - Ethical reasons - Research goal ??? Research goal: Have a requirement of representativeness -- ∴ Analysis based on .red[observed data] -- *Goal*: .center[.red[**Quasi**]-experiment<sup>*</sup>] .footnote[\* *Collins Thesaurus*: Quasi- = pseudo-, apparent, seeming, semi-, so-called, would-be] -- - **.red[Large] number of observations** - .red[Sufficient] variance in the observations - .red[Strong] assumption -- .pull-right[Why large number? Why?] --- ## How Large Is Large .pull-left[ Toss a fair coin: Head or Tail? <img src="images/large_toss.gif" height = 350 />] -- How about 1000 times? .pull-right[ 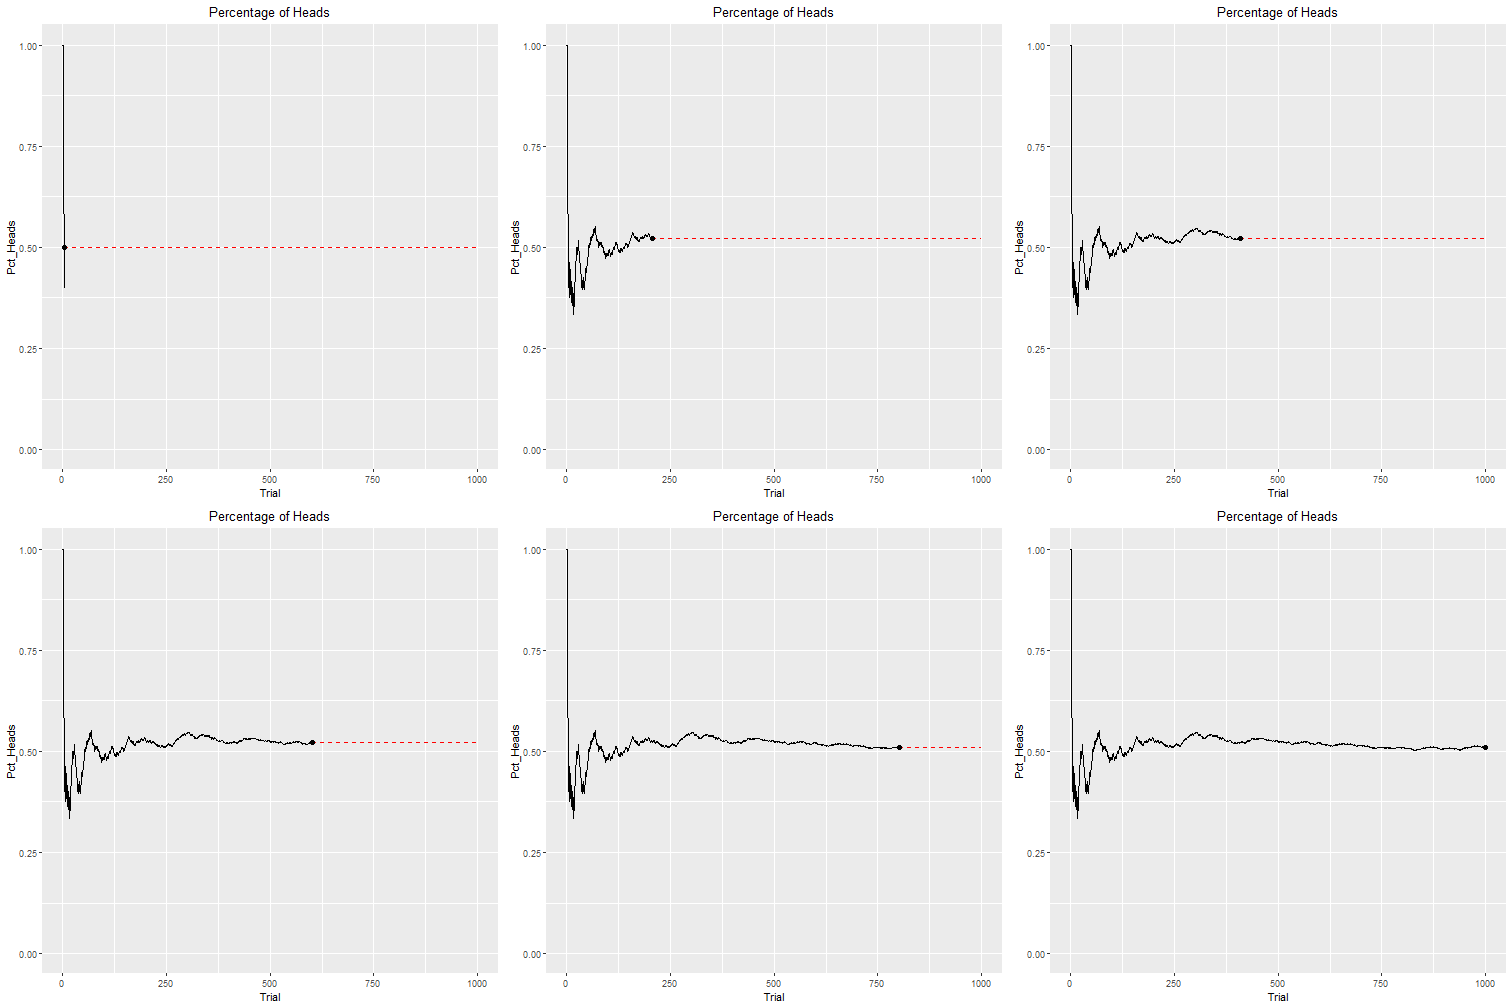<!-- --> ] ??? https://rpubs.com/pgrosse/545948 --- *Why large-N?* Answer 1: To unearth the probability! -- A.k.a., .bg-black.golden.ba.shadow-5.ph4.mt3[ .center[Law of Large Numbers (LLN)] ] `$${\displaystyle \lim _{n\to \infty }\sum _{i=1}^{n}{\frac {X_{i}}{n}}={\overline {X}}}$$` As the number<sup>*</sup> of experiments (sample) .red[increases], the ratio of outcomes will .blue[converge to] the theoretical (population) average. -- .footnote[\* Rule of thumb: > 100......Not enough, actually(略略略~] --- class: inverse, bottom # How to Conduct Large Analysis ## Why large-N hasn't been fully answered yet --- class: bottom, center ## Large-N Approaches **Univariate analysis** - Average - Deviation - Other moments -- **Bivariate analysis** - Cross-tabulating - Covariate - Difference in means -- .gray[ **Multivariate analysis** - Correlation analysis - Spatial analysis - Time series - Causal inference ] --- ## Data Whisper .pull-left[ Surveying seven dorm rooms asking the members did they watch the show. The right table is the records: ] .pull-right[ <table class="table" style="font-size: 25px; margin-left: auto; margin-right: auto;"> <thead> <tr> <th style="text-align:center;"> Student_ID </th> <th style="text-align:left;"> Episodes </th> </tr> </thead> <tbody> <tr> <td style="text-align:center;"> 2020996642 </td> <td style="text-align:left;"> 1 </td> </tr> <tr> <td style="text-align:center;"> 2020991501 </td> <td style="text-align:left;"> 1 </td> </tr> <tr> <td style="text-align:center;"> 2020997812 </td> <td style="text-align:left;"> 1 </td> </tr> <tr> <td style="text-align:center;"> 2020992534 </td> <td style="text-align:left;"> 2 </td> </tr> <tr> <td style="text-align:center;"> 2020998108 </td> <td style="text-align:left;"> 3 </td> </tr> <tr> <td style="text-align:center;"> 2020991166 </td> <td style="text-align:left;"> 3 </td> </tr> <tr> <td style="text-align:center;"> 2020993630 </td> <td style="text-align:left;"> 4 </td> </tr> </tbody> </table> ] ??? Let's say we'll test a school policy of Internet access management. To do so, researchers surveyed a dorm room, asking the members how many shows they watched in the past week. --- ## Univariate Analysis + Given the list: (1, 1, 1, 2, 3, 3, 4) -- + Mean: `\(\frac{1 + 1 + 1 + 2 + 3 + 3 + 4}{7} = \frac{15}{7} \approx 2.143.\)` -- + Median: 1, 1, 1, .magenta[2], 3, 3, 4 -- + Mode: three .magenta[1]s, one 2, two 3s, and one 4. --- ## Relations among These Ways Let's expand the data to 1000 dorms. <img src="10_largeN_files/figure-html/compareMean-1.png" style="display: block; margin: auto;" /> --- ## Mean, Median, or Mode? .pull-left[ <img src="10_largeN_files/figure-html/distribution-1.png" style="display: block; margin: auto;" /> ] -- .pull-right[ .huge[ Is mean enough? ] ] .footnote[Hint: Relating to the question of "why large-N"] --- background-image: url("images/large_game.gif") background-position: center background-size: contain ??? 1. Students standing in a line 1. Toss the coins six times - Head: left - Tail: right 1. Going down to the bottom line 1. Take a picture <video width="700" height="500" controls preload> <source src="https://link.jscdn.cn/1drv/aHR0cHM6Ly8xZHJ2Lm1zL3YvcyFBcnR0dk83MHdLSU8xR3lVRGoxaEpFODFDVkN0P2U9Vzh1bkMx.mp4" type="video/mp4"> </video> --- .pull-left[ <img src="10_largeN_files/figure-html/draws-.gif" style="display: block; margin: auto;" /> ] -- .pull-right[ *Why large-N?* .gray[Answer 1: To unearth the probability! (N > 100)] Answer 2: To estimate the distribution! A.k.a., .bg-black.golden.ba.shadow-5.ph4.mt3[ .center[Central Limit Theorem (CLT)] ] When .red[**independent**(!!!)] random variables are summed up, their properly normalized sum tends toward a .blue[normal distribution], even if the original variables themselves are not normally distributed. ] --- class: middle, large ## What Can A Large-N Sample Do? Show - The average/general status of the sample - How individual observations deviate from the average --- Beyond single variables...... ## Binary Analysis Relations between variables: .center[Are men more likely to smoke?] <div class="container st-container"> <table class="table table-bordered st-table st-table-bordered st-cross-table "> <thead> <tr> <th></th> <th colspan="2" align="center" class="st-protect-top-border">smoker</th> </tr> <tr> <td align="center"> <strong>gender</strong> </td> <th colspan="1" align="center">Yes</th> <th colspan="1" align="center">No</th> </tr> </thead> <tbody> <tr> <td> <strong align="center">F</strong> </td> <td> <span>147</span> </td> <td> <span>342</span> </td> </tr> <tr> <td> <strong align="center">M</strong> </td> <td> <span>143</span> </td> <td> <span>346</span> </td> </tr> <tr> <td> <strong align="center"><NA></strong> </td> <td> <span>8</span> </td> <td> <span>14</span> </td> </tr> </tbody> </table> </div> --- ## Scatter plot .center[Are old people more likely to be heavy smokers?] <img src="10_largeN_files/figure-html/scatter-1.png" style="display: block; margin: auto;" /> --- ## Controls What do controls do? -- Bring the Experimental Logic Back .center[<img src="images/lar_controlTreatment.png" height = 400 />] ??? How to assign the groups? --- ## Randomization = A Control .center[<img src="images/lar_balance.png" height = 500 />] --- ## What If You Cannot Randomize? <img src="images/lar_buyerSeller.jpg" height = 300, width = 320 /> <img src="images/lar_matching.png" height = 300, width = 320 /> <img src="images/lar_fitOLS.png" height = 300, width = 320 /> --- ## Controls May Not Work <iframe height="80%" width = "100%" src="//player.bilibili.com/player.html?aid=255446340&bvid=BV1CY41177uN&cid=568958340&page=1&t=323" scrolling="no" border="0" frameborder="no" framespacing="0" allowfullscreen="true"> </iframe> --- background-image: url("images/lar_mindmap.png") background-position: center background-size: contain ## Take-Home Points --- ## Procedure .pull-left[ ### Presenting (10min) The presenters talk. ### Challenging (10min) Drawing the Luck Dog <img src="images/cha_randomDraw.gif" height = 250 /> ] .pull-right[ *Process* 1. Presenters query. - A question about the paper 1. Challengers respond. 1. Challengers query. - A question about the presentation 1. Presenters respond. ] --- background-image: url("images/cha_challenge.gif") background-position: center background-size: contain